

NCERT Solutions for Class 9 Economics Chapter 3 – Poverty as a Challenge contains the solutions to the exercises given in the economics book. These NCERT solutions will be useful for school exams as the source of these are from the NCERT textbooks. The NCERT solutions are easy and accurate, which will help school students prepare well, as per the questions asked in the examinations.
Poverty as a Challenge: NCERT Solutions Class 9 Economics
Intext questions of the Chapter Poverty as a Challenge Class 9 Economics
Page – 30
(i) Landlessness
(ii) Unemployment
(iii) Size of families
(iv) literacy
(vi) Child labour
(v) Poor health/malnutrition
(vii) Helplessness
Answer
(i) Landlessness: Landless labourers in the villages are generally poor. They usually belong to the depressed sections of society and earn very low wages. They are also subject to seasonal unemployment, when they have to do odd jobs at very low income.
(ii) Unemployment: If the labour force is idle and unutilised due to unemployment, the level of income is reduced and the unemployed persons cannot afford even the essentials of life, leading to poverty.
(iii) Size of Families: When the number of persons in a family increases, the income of the family becomes less than what is the minimum required to provide them the essentials for proper living. This ultimately leads to poverty.
(iv) Illiteracy: Due to poverty, the parents are not able to send their children to school and thus increase their earning power. Later on, when these children become adults and enter the job market, they are unable to find well-paying jobs, resulting again in poverty. Thus illiteracy and poverty depend on each other.
(v) Poor Health/Malnutrition: Poverty causes malnutrition and poor health, as the poor people cannot afford adequate amounts of nutritious food or proper medical services. Once they are malnourished or in poor health, they are not able to work productively and thus they get more poor.
(vi) Child Labour: Poverty forces the parents to make their children work, although there is a law against child labour. This makes children drop out from school, resulting in their not getting well-paying jobs when they grow up.
(vii) Helplessness: Due to poverty, the poor people become helpless and are willing to do any work for a low income. This leads them further into poverty.
On Page – 32
Q.1. Why do different countries use different poverty lines?
Ans. Different countries use different poverty lines because
(a) The calorie requirement of different human races is different depending on their physical condition and dietary habits. Those races which have greater height and build require higher calories.
(b) The per capita income in different countries is also different i.e., per capita income is higher in developed countries as compared to developing countries.
(c) The standard of living of Western countries is higher than that of developing countries.
(d) The cost of essential items used in calculating poverty line is higher in the developed countries.
Q.2. What do you think would be the ‘minimum necessary level in your locality?
Answer
I live in a city so the poverty line should be calculated according to the urban area.
In the year 2010-11, the urban poverty line was fixed at Rs 1000 per month per person but seeing the high level of inflation and price rise it should be at least? 1500 per person per month.
Page – 33
Q.1. Study the table 3.1 and answer the following questions
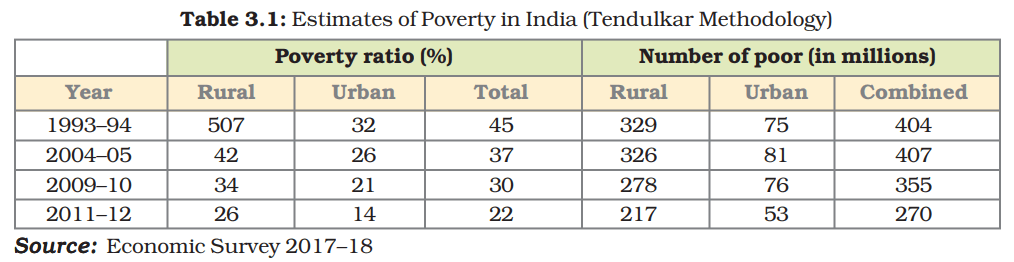
(i) Even if poverty ratio declined between 1993-94 and 2004-05, why did the number of poor remain at about 407 million?
Ans. The poverty ratio declined between 1993-94 and 2004-05 but the number of poor remained at about 407 million because the total population of the country increased during the same period. Out of this increased population more people got employment due to the green Revolution, establishment of more industries and growth of the tertiary sector. As result the poverty ratio declined.
(ii) Are the dynamics of poverty reduction the same in rural and urban areas?
Ans. No, the dynamics of poverty reduction are not the same in rural and urban areas because the conditions in both the areas are completely different.
Urban area poverty has decreased due to expansion of the service sector, increased industrialisation and consequent increase of jobs. This has resulted in migration to cities and towns from rural areas. Rural area poverty has reduced due to improved agricultural practices resulting in higher incomes. Some contribution to this improvement is due to the migration to urban areas.
Page – 35
Q.1. Observe some of the poor families around you and try to find the following
Answer There is a poor family living near our colony. They are living below the poverty line and belong to lowest socio-economic category.
(ii) Who are the earning members in the family?
Answer The wife and husband are casual construction labourers and they are the earning members of the family.
(iii) What is the condition of the old people in the family?
Ans. The old people of the family, i.e., the grandparents are physically weak and suffering of old age diseases and problems without proper medical aid.
(iv) Are all the children (boys and girls) attending school?
Answer There are two girls and one boy in the family. Because of poverty, the father of the children Bhola is only able to send his son to school and the daughters help in the household work.
Page – 36
Q.1. Study the graph 3.2 and do the following

(i) Identify the three states where the poverty ratio is the highest.
Answer Three states where poverty ratio is the highest are
(a) Bihar 33.7%, (b) Odisha 32.6%, (c) Assam 31.9%
(ii) Identify three states where poverty ratio is the lowest.
Answer Three states where the poverty ratio is the lowest are
(a)Kerala 7.1%
(b) Himachal Pradesh 8.1%
(c) Punjab 8.3%
Q.2. Study the graph 3.4 and do the following

(i) Identify the areas of the world, where poverty ratio has declined.
Answer The areas of the world where poverty ratios have declined are
(a) South Asia (b) East Asia and Pacific (c) China
(ii) Identify the area of the globe which has the largest concentration of the poor.
Answer Sub-Sahara africa is the area of the globe which has the largest concentration of the poor.
Poverty as a challenge Textbook Exercises solutions
Page – 40
Q.1. Describe how poverty line is estimated in India.
Ans. A common method used to measure poverty is based on income or consumption levels. A person is considered poor if his or her income or consumption level falls below a given minimum level necessary to fulfil basic needs.
(a) While determining the poverty line in India, a minimum level of food requirement, clothing, footwear, fuel and light educational and medical requirement etc are determined for subsistence. These physical quantities are multiplied by their price in rupees.
(b) The present formula for food requirement while estimating the poverty line is based on the desired calorie requirement.
(c) Food items such a cereal, pulses, vegetables, milk, oil, sugar etc together provide these needed calories. The need of calories depends on age and the work done by a person.
(d) The accepted average calorie requirement in India is 2400 calories per person per day in rural areas and 2100 calories per person per day in urban areas.
(e) The calorie requirement of the people in rural areas is higher than that of the people living in urban areas because they do more physical work as compared to urban people.
(f) On the basis of these calculations for the year 2010-11, the poverty line for a person was fixed at Rs 816 per month for the rural areas and Rs 1000 for the urban areas.
(6) Despite less calorie requirement the higher amount for urban areas is because of the high prices of many essential products in urban centres.
Q.2. Do you think the present methodology of poverty estimation is appropriate?
Ans. No, the present methodology of poverty estimation ie appropriate because it takes into account only the basic needs of to in clothing, fuel, etc. But the quality of these basic necessities is the lowest, quality available, which is not appropriate.
(a) The amount which is fixed as the poverty line does not include margin for price fluctuations and price rise which is constant occurring.
(b) The poverty line should include some correction for inflation and take care of the market fluctuations.
Q.3. Describe the poverty trends in India since 1973.
Ans. There was a substantial decline in poverty ratios in India from about 55 % in 1973 to 36 % in 1993.
(a) The proportion of people below poverty line further came down to about 26 % in 2000.
(b) If the trend continues, people below poverty line may come down to less than 20 % in the next few years.
(c) Although the percentage of the people living under poverty declined in the earlier two decades (1973-1993) the number of poor remained stable around 320 million for a fairly long period.
(d) The latest estimates indicate a significant reduction in the number of poor to about 260 million.
Q4. Discuss the major reasons for poverty in India.
Ans. The various causes of poverty in India are
Colonial Economic Policies
(a) One historical reason of poverty in India is the low level of economic development under the British colonial administration.
(b) The policies of the colonial government ruined traditional handicrafts and discouraged developments of industries and textiles.
(c) The low rate of growth persisted until the 1980s. This resulted in less job opportunities and low growth rate of incomes.
(d) The government failure on both fronts, i.e., promotion of economic growth and population control perpetuated the cycle of poverty.
Not Enough Jobs in Industries
The industries set up in the public and private sector provided jobs to many people but the number of job seekers was far more than the jobs available and a large number of people remained unemployed leading to poverty.
Green Revolution and Employment
(a) The Green Revolution enabled multiple cropping or growing of 2 to 3 crops in, year, which created demand for labour in the agriculture sector. However, the Green Revolution was limited mainly to Punjab, Haryana and Western Uttar Pradesh and provided limited opportunities of work.
(b) The poor farmers could not buy inputs for farming and landholdings were small. Thus, their production was low and the poor peasant families could hardly survive.
(c) The poor, especially in rural areas had to take loans for farming inputs and many times were unable to repay the loan. Thus, they fell into a debt trap, leading to a worse situation.
(d) Another cause of poverty has been the huge income inequalities. One of the major reasons for this is the unequal distribution of land and other resources.
(e) Many communities like the Dalits, scheduled castes and scheduled tribes had traditionally been deprived of education, land and social status. Consequently, they have not been able to raise their standard of living in the absence of education, land and other resources.
(f) To fulfil social obligations and observe religious ceremonies, people in India including the very poor, spend a lot of money. They hardly have any savings, so they borrow money and are unable to repay the loans because of low income, thus falling into a debt trap leading to extreme poverty.
(g) Small farmers need money to buy agricultural inputs like seeds fertilisers, pesticides etc for which they have are unable to repay, thus falling into a debt trap leading to extreme poverty.
Answer
(a) The social groups which are most vulnerable to poverty are scheduled caste and scheduled tribe households.
(b) Similarly, among the economic groups, the most vulnerable groups are the rural agricultural labour households and the urban casual labour households.
Q.6. Give an account of interstate disparities of poverty in India.
Answer
(a) The proportion of poor people is not the same in every state.
(b) Government has made many efforts to reduce poverty by following various programmes but the success rate of reducing poverty is different in different states.
(c) In 20 states and union territories the poverty ratio is less than the national average.
(d) Poverty is still a serious problem in Orissa, Bihar, Assam, Tripura and Uttar Pradesh.
(e) Orissa and Bihar continue to be the two poorest states with poverty ratios of 47% and 43 % respectively.
(f) There has been a significant decline in poverty in Kerala, Jammu and Kashmir, Andhra Pradesh, Tamil Nadu, Gujarat and West Bengal.
(g) States like Punjab and Haryana have traditionally succeeded in reducing poverty with the help of agricultural growth rates.
(h) In West Bengal, land reform measures have helped in reducing poverty.
(i) In Andhra Pradesh and Tamil Nadu, public distribution of food grains has been responsible for the reduction of poverty.
Q.7. Describe global poverty trends.
Ans. The proportion of people in developing countries living in extreme economic poverty i.e., on less than $1 per day as defined by World Bank has fallen from 28 % in 1990 to 21 % in 2001.
There has been a substantial reduction in global poverty, but it is marked with great regional differences
(a) Poverty declined substantially in China and South Asian countries as a result of rapid economic growth and massive development.
(b) The number of poor in China has come down from 606 million 1981 to 212 million in 2001.
(c) In the countries of South Asia (India, Pakistan, Sri Lanka, Nepal, Bangladesh, Bhutan) the decline has not been so rapid, it has declined marginally from 475 million in 1981 to 428 million in 2001.
(d) In the Sub-Saharan Africa, poverty rose from 41 % in 1981 to 46 % in 2001.
(e) In Latin America the ratio of poverty has remained the same.
(f) Poverty has resurfaced in some of the former socialist countries like Russia, where it was non-existent earlier.
Q.8. Describe current government strategy of poverty alleviation.
Ans. The current anti-poverty strategy of the government is based broadly on two planks
Promotion of Economic Growth
(a) India’s economic growth gained momentum and since the eighties has been one of the fastest in the world.
(b) The growth rate jumped from the average of about 3.5 % a year in 1970’s to 6 % during the 1980’s and 1990’s.
(c) The higher growth rates have helped significantly in the reduction of poverty.
(d) It is becoming clear that there is a strong link between economic growth and poverty reduction.
(e) Economic growth widens opportunities and provides resources to invest in human development.
(f) This also encourages people to send their children, including girls, to schools in the hope of getting better economic returns from investing in education.
Targeted Anti-Poverty Programmes
Promotion of economic growth was a long-term time solution to the problems, but a need was felt for short term target oriented anti-poverty programmes which the government ultimately undertook. Some of the programmes to remove poverty are
(a) National Rural Employment Guarantee Act (NREGA) 2005
(b) National Food for Work Programme (NFWP) 2004
(c) Prime Minister Rozgar Yojana (PMRY) 1993
(d) Rural Employment Generation Programme (REGP) 1995
(e) Swarnjayanti Gram Swarozgar Yojana (SGSY) 1999
(f) Pradhan Mantri Gramodaya Yozana (PMGY) 2000
(g) Antyodaya Anna Yozana (AAY)
Q.9. Answer the following questions briefly
(i) What do you understand by human poverty?
(ii) Who are the poorest of the poor?
(iii) What are the main features of the National Rural Employment Guarantee Act, 2005?
Answer
(i) Human poverty is a definition of poverty which takes us beyond general definitions of poverty i.e., not having enough money. Being able to earn a fixed amount as set by the government as poverty line does not actually free them from poverty.
A person who is unable to get proper education and shelter and nutritious food, or if a child is forced to child labour or they face social and caste discrimination, then they come under human poverty.
(ii) Women, elderly people and female infants are the poorest of the poor is society.
Women, elderly people and the girl child are systematically denied equal access to the resources available in the family. That is why they and considered the poorest of the poor.
(iii) The main features of National Rural Employment Guarantee Act, 2005 are
(a) The act provides 100 days assured employment every year to every rural household in 200 districts. Later the scheme will be extended to 600 districts.
(b) 1/3rd of the proposed jobs would be reserved for women.
(c) The central government will also establish National employment Guarantee Funds. Similarly, the State Government will also establish the State Employment Guarantee Funds for the implementation the scheme.
(d) Under the scheme if an applicant is not provided employment within 15 days, he/she will be entitled to a daily unemployment allowance.